Call Us: 949-458-7794
Forecasting Construction Materials
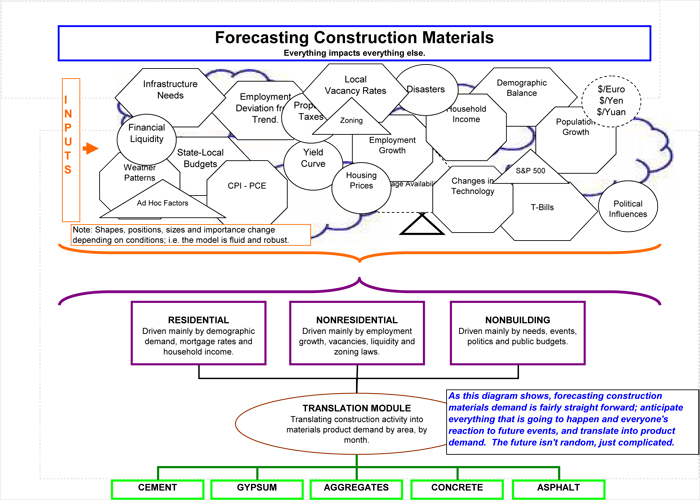
Turning Contracts Into Materials Demand
What's Different About Using the Complexity Approach?
The Complexity Approach uses a different perspective than past analytical tools. This new perspective makes all the difference in the world. Think of it as viewing the Earth as round instead of as flat. If our horizon is only a few miles, both a flat Earth and a round Earth mentality, make almost no difference. But if we want to expand our horizons, the flat Earth view quickly becomes inferior.
How Complexity is Different
- Normal Business Models Complexity Based Models Why Complexity is Better
- Most Equations and Assumptions Linear Non-linear More Realistic
- Behavior Fixed Adaptive More Realistic
- Technology Fixed Increasing More Realistic
- Change Little Constant More Realistic
What is The Optimum Size of a City?
The two charts that follow again show the danger of using linear, non-technology aware, models. The objective is to forecast the population growth rate of a growing metro area in the Southeast U.S. Other models have shown that this city will grow at 3+% for the next ten years. The David Chereb Group conclusion is that population growth will average under 2% per year. Why the difference?
The answer lies in the basics. Why do cities exist? Have these reasons changed or have circumstances changed? Cities exist because they provide economies of scale; i.e. it’s cheaper to produce in the city. One hundred years ago this held for industrial activity. Thirty years ago economies of scale existed for services, such as investment banking.
What About Now?
Do large cities still provide economies of scale?... Our answer is shown in the right chart.
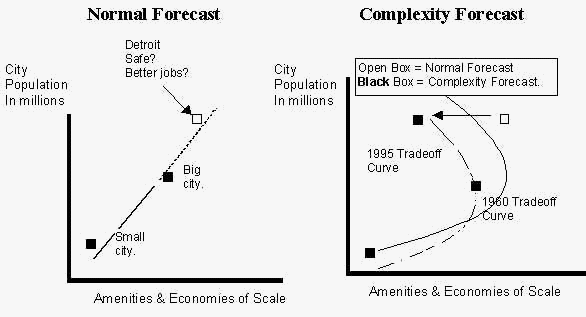
Our conclusion is that there is a non-linear relationship between population size and ‘quality of life’. First, larger cities do have more to offer in jobs, theater, professional sports, etc. Second, very large cities offer less than large cities due to crime, smog, traffic congestion. In addition the dotted line shows our conclusion about how this relationship is changing over time—large cities are becoming even less attractive and smaller cities are becoming more attractive. This means Detroit and other very large cities will not be able to compete with more moderate size cities that have more to offer growing companies and growing families.
The driving forces behind these shifting curves are: telecommunications, computers, an advanced infrastructure, and schools. While only about 5% of the workforce primarily work at home, at least another 5% do some work at home. What they need is: a computer, a modem, software, a phone line, good work habits and skill. Another 15% works in smaller satellite offices in suburban areas. With widespread videoconferencing and fast data links available to almost any location in the U.S., the slight advantage of large cities, is rapidly disappearing. The dotted line will shift left and down.
What difference does all this make?
- The best workers will be found outside the big cities.
- The most efficient work location will be outside the big cities.
- The best construction opportunities will be outside the big cities.
- The fastest growing areas will be smaller cities (and rural areas for the first time in over 60 years)./li>
The Complexity Approach leads to a completely different set of strategies for cement and aggregates forecasting. The traditional approach leads to dead end recommendations. If the optimum size of a city was 8 million in 1950, it was 6 million in 1990 and will be 4 million in 2010. Beyond the year 2010, large cities will have to transform themselves, or become irrelevant.